Using Visual Studio to Write Node for Devices
In previous blog posts, I explained how to setup your Intel Edison and how to start writing code for it. And in case you got here directly, I created a full index of my Edison posts to help you find what you need.
In this post, we’ll take a look at writing code for it using Visual Studio. Visual Studio, once you add the free Node.js Tools for Visual Studio plugin, happens to be pretty great at working with Node.js projects. It runs node behind the scenes, so it offer the following…
- Editing
- Intellisense
- Profiling
- npm
- TypeScript
- Debugging (local, remote, and Azure!)
That’s an impressive list, and we’ll take a look at a few of these features in this post.
Closer to the end of this post, I’ll tell you about my edref project. “edref” stands for Edison Reference project and is intended to get you started quickly with an Intel Edison project in Visual Studio. If you want to skip all the rhetoric and just download the reference project, I’ll understand.
Visual Studio
In case you missed the announcement in November, Visual Studio Community edition is now free. That’s huge. The Community edition is essentially the existing Professional edition, and facilitates a huge array of development scenarios. VS is intuitive, intelligent, and has a lot of Microsoft and community support behind it.
Installing Visual Studio Community 2013
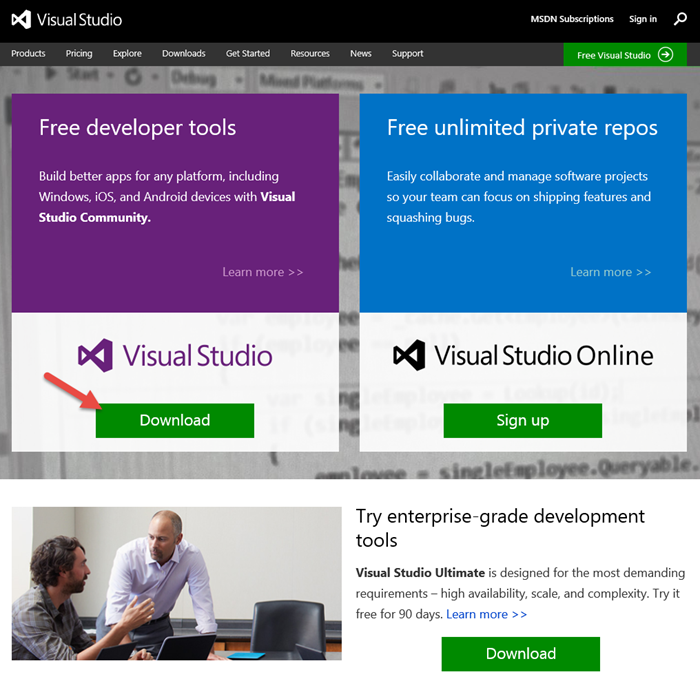
To download Visual Studio, start at visualstudio.com, but know that visualstudio.com sort of has two meanings right now. Visual Studio is the IDE, but it’s also the ALM tools for taking any size projects from conception to completion with any size group of developers. So click the download button under Visual Studio the IDE and (at least at the time of this writing) you’ll get a direct link to the Visual Studio Community 2013 package.
Installation is pretty straight-forward, and I won’t include a screenshot series, but one decision you will have to make is which features of the product to install. Do you want to play with Lightswitch? Windows Phone? Just check the boxes.
The next version of Visual Studio is Visual Studio 2015 and there’s pretty good support for it already (including a working version of the Node.js Tools), so if you want to be a trailblazer at work, go for it.
The Node.js Tools for Visual Studio
Installing the Tools
The Node.js Tools are found at nodejstools.codeplex.com. Go there and click the gigantic, unmistakable DOWNLOAD button. Again, the download is assumedly self-explanatory.
Creating a New Project
Creating a project using Node.js in Visual Studio begins like any other project type - with the File | New Project dialog…
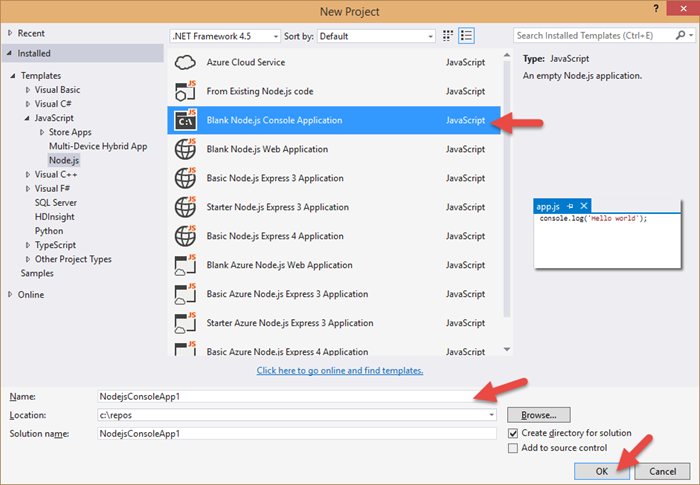
There are a number of projects to choose from. For what we’re dealing with - writing Node.js for devices - the Blank Node.js Console Application will suffice. The rest are web applications for creating node apps on the server.
As per usual, give your project a name and location and OK away.
Now, when Visual Studio finished with our bidding, let’s take a look at what we’ve got…
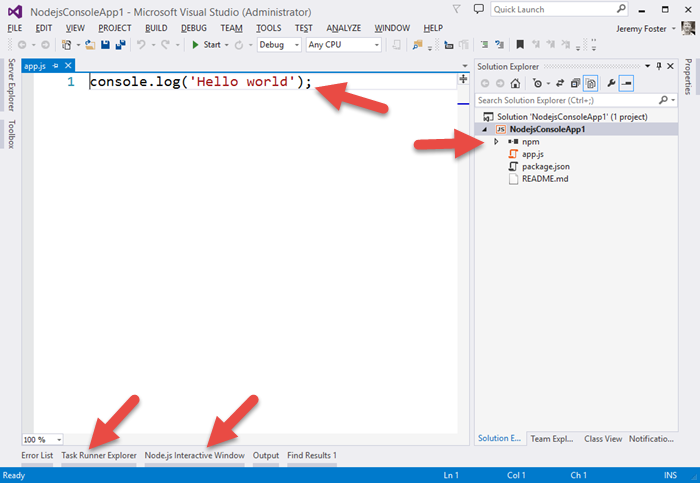
Let me point out a few things.
First of all, perhaps the simplest Hello World app in the world :) Next, notice the npm folder in the project. This is going to give you a graphic way of managing your npm packages. Some people like to do things the graphic way. I personally never use this, but for some people it’s just your kind of thing. It actually works pretty slick too showing you all of your global modules, all of the modules that are installed, and visually differentiating the packages that have been added to your package.json file.
If you begin typing a dependency directly into the package.json, it gives you some Intellisense with an under-the-covers search of the npm repository, and it even helps you with the version…
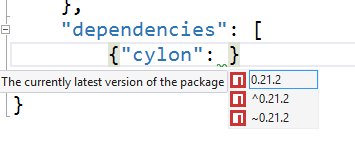
I like that. I never type my dependencies in directly, but if I did, I’d certainly come to rely on it.
You can also use the npm dialog to install packages.
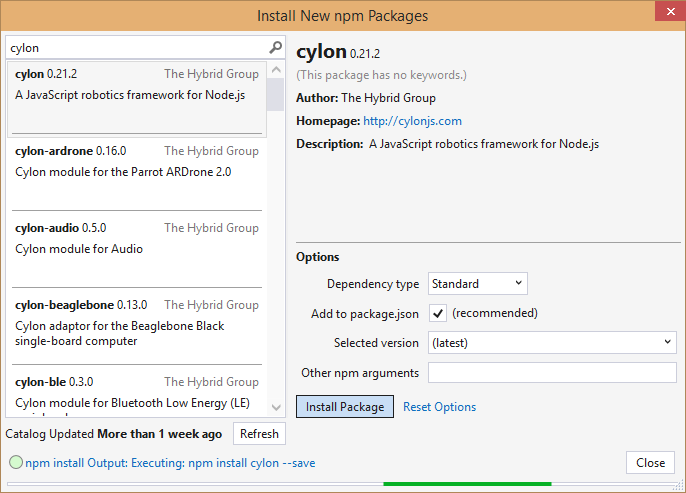
Again, nice, but I still keep a CLI open and execute npm install mypackage --save on my own. And of course, in that case, all of the installed packages are recognized by the tools, so I do enjoy having the visual indication that my package has been installed.
By the way, if you want to create a new Visual Studio Node.js project from an existing Node.js project that you have in your file system (perhaps recently cloned with git?) then check out my post Open an Existing Node.js Project in Visual Studio.
Using gulp for Deployment
We saw in the last post in this series how to wirelessly deploy your code to your device. You can keep doing it that way if you want, but there’s an easier way. Deploying your code is essentially a build task, and that’s what grunt and gulp are for.
NTVS also gives you a little bit of help with grunt and gulp. It’s hilarious that most people still refer to “grunt and gulp” whenever they talk about JavaScript task running frameworks. They do the exact same thing and I don’t imagine to many folks actually use grunt _and _gulp. Rather, most likely use grunt if they have to and gulp if they can. gulp is better hands down. grunt uses JSON files for configuration of tasks and gulp uses JavaScript. So, instead of composing gigantic JSON files to attempt to define what sort of tasks you need to run, you can stay in code and do whatever the heck you want or need. And gulp is supposedly way faster too, although I haven’t done any of my own tests.
Adding some gulp tasks to your app is easy. You just add a gulpfile.js to the project and add the gulp npm module both globally and at the project level.
The edref project has a little bit of gulp built in to deploy your code to your Edison device. Here’s that gulpfile.js content so we can talk about what gulp tasks look like…
/// <vs BeforeBuild='jshint' AfterBuild='deploy' />
var gulp = require('gulp');
var config = require('./config');

// JS hint task
// this is just a nice library for making sure your JavaScript syntax is all good
var jshint = require('gulp-jshint');
gulp.task('jshint', function () { // <--------------
    gulp.src('./*.js')
    .pipe(jshint())
    .pipe(jshint.reporter('default'));
});

// deploy to the device
// NOTE: this will only deploy files at the root level; it is not recursive

var scp = require('gulp-scp2');
gulp.task('deploy', function () { // <----------------
    return gulp.src(['*.{js,json}', '!gulpfile.js'])
        .pipe(scp({
            host: config.host,
            username: config.user,
            password: config.password,
            dest: config.deployFolder
        }))
        .on('error', function (err) {
            console.log('ERR: ' + err);
        });
});
Notice the actual gulp tasks (where I put the <------------ indicators). Those define what tasks are configured to run.
Now this next part I love. Visual Studio looks at the gulpfile.js at these tasks and adds them to a new pane called the Task Runner Explorer…
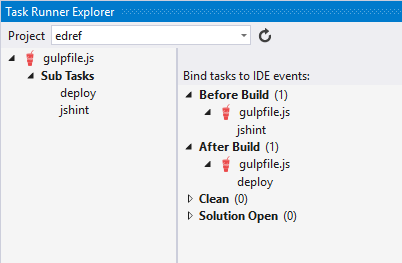
So jshint and deploy under Sub Tasks exist because they are defined in the gulpfile.js code.
Any time you need (or just want), you can right click one of those bad boys and hit Run and just run your tasks ad hoc individually. But also notice that under Before Build I have determined that the gulpfile.js/jshint task should run, and After Build the gulpfile.js/deploy task should run. That means that I can change a line of code, hit CTRL+SHIFT+B to build my project, and know that the targeted Edison (whether it’s on my desk or installed in a wall or gadget absolutely anywhere!) is going to contain the latest version of my project. That’s pretty awesome.
I’m working on another task as we speak that will fire off the node process for that app so your device will not only get its code, but start cranking on it as well.
Remote Debugging
Another scenario unlocked for us using the NTVS tools is debugging - even remote debugging. I’m thrilled about this one.
Note that you can also check out the official documentation for the remote debugging feature of the NTVS tools.
I did a little research online and found that most people working with devices are resorting to the classic console.log method of debugging. When you’re writing Wiring code for an Arduino, for example, you use a serial debug library that allows you to send messages back to the console in your Arduino IDE. You can then add something like…
Serial.println("Made it here!");
This reminds me of JavaScript development circa 1999 and by no means turns my crank.
What does turn my crank is running my project, perhaps watching a couple thing happen on my gadget, then hitting a breakpoint in my code in Visual Studio and being able to hover over any variables to see what their value is and hit F5 to continue. That’s an awesome dev scenario!
Here’s how to do it.
Write or open a Node.js project targeting your device.
You can clone http://github.com/codefoster/tweetmonkey if you’re looking for inspiration. You can see more about my good friend TweetMonkey at codefoster.com/tweetmonkey, but in short, he taps into Twitter’s streaming API and waits for tweets with the hashtag #tweetmonkey. When he see’s one, he comes to life, nods his head, squeaks, and clangs his symbols. My 3 year old loves it :)
Make sure you have a RemoteDebug.js deployed to your device
I like to include the RemoteDebug.js file in my project and check it into source so it’s ready to go for anyone that clones the project.
If you have the NTVS tools installed, you have this file. To see where it is, go to Tools | Node.js Tools | Remote Debugging Proxy | Open Containing Folder. Copy that file to your project or deploy it directly to your device. By the way, the gulp task that I include with the edref project (see later) copies all .js files, so if you put the RemoteDebug.js file in your project, it will get deployed automatically.
Execute your node app
You normally execute your app by remoting to your device (using something like ssh root@mydevice.local), changing to your project folder, and then executing the line…
node app.js
For remote debugging, you do it like this…
node RemoteDebug.js app.js
…and you should get some feedback like…
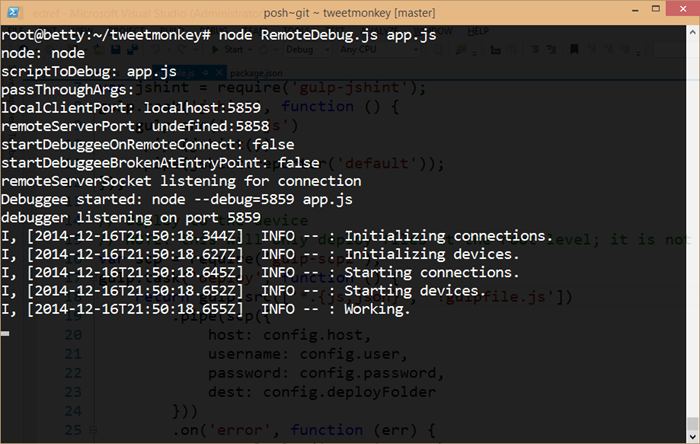
So you can see that the RemoteDebug.js file is launching a proxy for us using port 5858. And it introduces a term that was new to me - debuggee. I think I like it.
With that going, we’re ready for the next step.
Attach to Process from Visual Studio
In Visual Studio, go to the Debug menu and Attach to Process… and change the Transport to Node.js remote debugging.
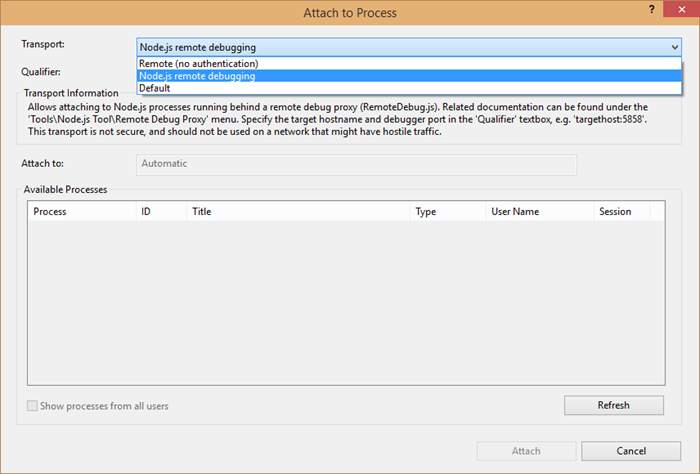
Now, in the Qualifier field, enter tcp://devicename.local:5858 and check the Show processes from all users box. You should see your node process appear in the Available Processes.
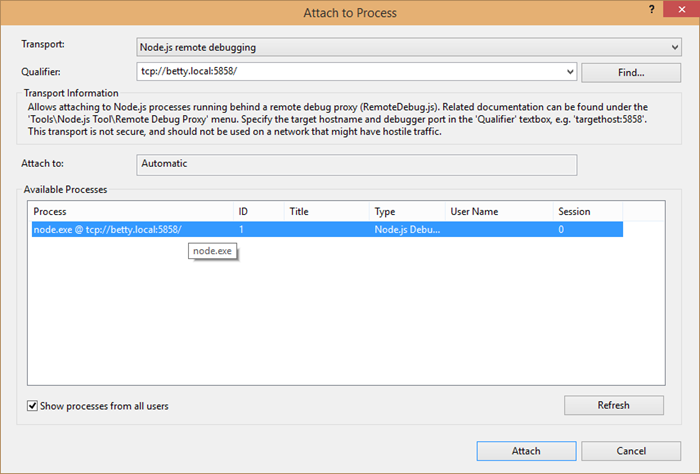
Attach.
Now set a breakpoint.
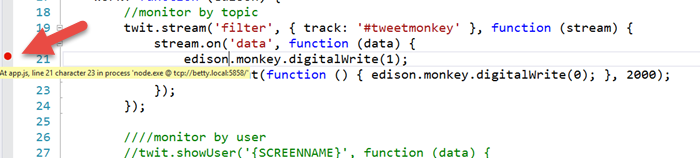
And in the case of the app we’re working with here (tweetmonkey), send a tweet to hashtag #tweetmonkey and you should break at your breakpoint. As the French say, “Formidable!”
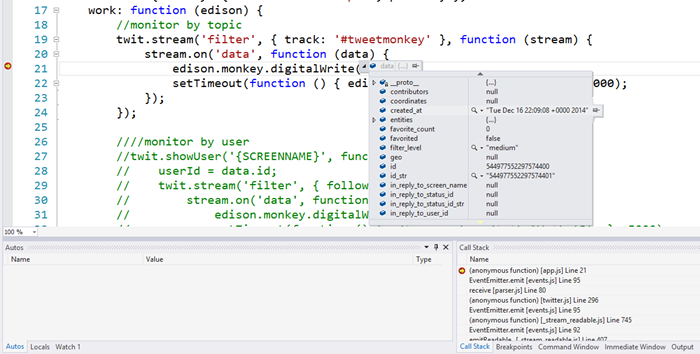
And, of course, in typical VS fashion, while broken, you can hover over JavaScript objects and check out all of their property values.
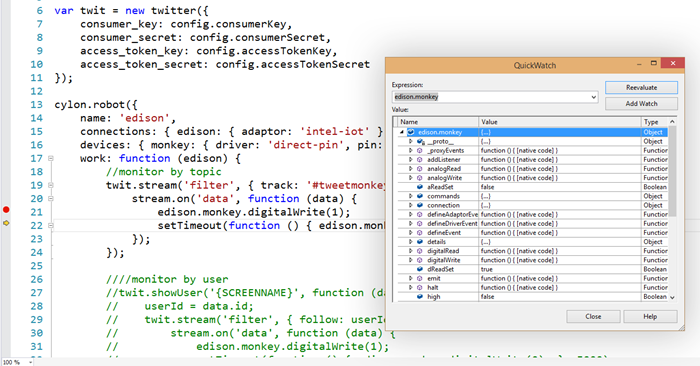
And you can open QuickWatch and enter any dynamic expressions you want and browse the results.
So, now you’re cruising!
The edref Project
There’s one last thing that I said I’d talk about, and that’s my edref project. There are a few things to do to set up a good, working Node.js environment in Visual Studio that will get you the kind of rich development environment I’ve lined out. It’s not a lot, but there’s not sense in doing it from scratch every time, so I’ve created a project called edref on GitHub that you can clone and get started right away. Feel free to fork and issue pull requests if you have ideas for how to improve it. I personally use this project for starting new hardware hacks, so when I find more efficient ways to do something, I’ll update the GitHub project.
The one thing I’d like to point out about the project is that the gulpfile.js is all set up to deploy your project to a remote device. You just have to fill out the config.js file with your particulars.
Conclusion
You should have what you need to not only write code for your Intel Edison, but write it in Visual Studio style! If you have any questions about this, please let me know in the comments. Consider this a living blog post still in that I’ll add edits here as I learn more about this fun device.
Happy hardware hacking!